Whitepapers
AI in eCommerce - Top 10 AI tools
What is AI in eCommerce and which are the top 10 tools you should know about? We put together a list of 10 AI tools that can help grow your eCommerce...
This comes as good news for all businesses in the eCommerce industry. However, it also translates to bigger amounts of data that need to be processed and a higher complexity. That is why any business owner should know which are the best eCommerce KPIs to keep an eye on in 2022.
Key Performance Indicators (KPIs) are the most important metrics you should take into consideration, in order to see how your business is performing. Even though there is a multitude of such indicators, some are more relevant than others, depending on your end-goals.
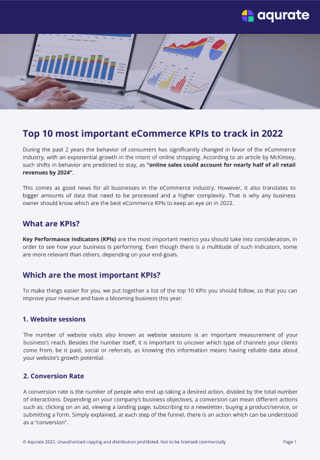
To make things easier for you, we put together a list of the top 10 KPIs you should follow, so that you can improve your revenue and have a blooming business this year:
The number of website visits also known as website sessions is an important measurement of your business’s reach. Besides the number itself, it is important to uncover which type of channels your clients come from, be it paid, social, or referrals, as knowing this information means having reliable data about your website’s growth potential.
A conversion rate is the number of people who end up taking a desired action, divided by the total number of interactions. Depending on your company’s business objectives, a conversion can mean different actions such as: clicking on an ad, viewing a landing page, subscribing to a newsletter, buying a product/service, or submitting a form. Simply explained, at each step of the funnel, there is an action which can be understood as a “conversion”.
Find out more details about how to increase the Conversion Rate on our latest eBook: Product Pages That Convert →
The Ad Spend measures the total amount of money that is spent on ad efforts on various platforms. This metric is very important in order to fully understand how your budget is consumed. Moreover, it is a metric that contributes to the Return on Ad Spend (ROAS) which is a good indicator of whether specific investments in promotional activities are paying off.
The ROAS is the total amount of revenue your business receives for every dollar spent on advertising. This indicator is important for measuring the effectiveness of paid marketing campaigns, as it signals which ads are performing well. Depending on how extensive your marketing efforts are, ROAS can be measured at the level of a singular ad or rather at the level of a whole campaign.
Most companies define valid orders as all orders placed, except for those that are canceled, voided, fraudulent, or worth nothing (e.g., bought with gift cards). It is important to use the Number of Valid Orders to get accurate results when calculating other metrics which are dependent on them, such as the Average Order Value (AOV), Customer Lifetime Value (CLV), or the Number of Purchases per Customer.
The Customer Acquisition Cost, also known simply as Acquisition Cost, is calculated by summing up all the expenses related to acquiring new customers (e.g., Ad Spend) and dividing the sum by the number of total new customers, acquired in a specific time frame. Thus, with this metric you can find out whether your marketing efforts translate into actual clients.
The CLV is the total amount of money that a client is expected to spend on your store’s products or services. This indicator is usually computed based on the average lifetime of a customer, or based on set intervals (e.g., 1 year, 2 years). With its help, you can make informed decisions about marketing spending, as you should always keep an eye on the ratio between CAC and CLV. Moreover, identifying customers with high CLV allows you to understand the profile of your high-rollers, and effectively segment your customer base for acquisition and retention purposes. Increase your CLV by sending emails containing personalized product recommendations.
This indicator tracks the average value of all the Valid Orders. Thus, it is a helpful metric for understanding the behavior of your clients and whether they tend to make small or big purchases. To uncover valuable knowledge, we recommend you look at the AOV by customer acquisition source and customer demographics. Lastly, this metric is directly related to revenue; therefore, it should be constantly monitored as finding a way to maximize the AOV means finding a way to boost profits. Increase the AOV using AI-driven product recommendations.
The rate of return is the percentage of products ordered that end up being sent back by customers. Depending on the industry you are active in, the rate of return can be higher (e.g., apparel industry) or lower (e.g., healthcare industry). However, a high return rate should not affect the customer experience if the right return policy is in place. Moreover, the value of this indicator can simply be improved by identifying what the main problem behind the returns is, such as updating the sizes chart or adding better product photos.
This indicator represents the time between order placement and order shipping. It is influenced by shipment delays, stock depletion, bureaucracy, faulty address shipments, and unnecessarily lengthy protocols for order processing. Because of all these unpredictable bottlenecks, having a stable workflow and a great order automation tool is an effective way to improve the value of this indicator.
Now that we have a clear list of KPIs, it would only be fair to mention some of the challenges which they can pose to you and your employees:
Based on Aqurate’s research it takes about 199 hours per year for each eCommerce professional to gather and compute all the data required for calculating KPIs (this does not include the actual evaluation of KPIs!). This means both a loss of time and money, resources which you might put to better use in some other way.
Another challenge is the existence of too many KPIs, which can make it hard for you to select which ones are the most suitable to track. At the same time, tracking an excessive number of KPIs might be an unnecessary spend of resources, as you will end up even more confused about the course of action you should take.
Lastly, there are various methods of calculating most KPIs and these differences can result in long internal debates and discussions about the true values of KPIs. Instead of clarity and efficient decision-making this can lead to complexity and confusion.
About us
This guide has been written in collaboration with easySales – the B2B Romanian platform that automates the listing and sales processes of your business. More information is available on www.easy-sales.com.
Download our latest eBook: Product Pages That Convert →
What is AI in eCommerce and which are the top 10 tools you should know about? We put together a list of 10 AI tools that can help grow your eCommerce...
It can be challenging to choose the right product recommendation engine for your eCommerce shop. Here's a list of the 9 must-have features you should...
Product pages that convert eBook explores the key elements of a successful product page and provides you with best practices for optimizing your...